Most days, nothing's actively wrong with your sites. But "nothing's wrong" isn't quite the same as "nothing needs your attention." There's almost always a cert quietly drifting toward its expiry, a site that's been a touch slower than usual all week, a renewal coming up in three weeks. What you actually want when you open DomainDash is a sentence or two at the top that just tells you which of those, if any, matter today.
That's the bit that landed this week.
The all-sites card grew up
A couple of weeks ago the redesigned sites dashboard introduced an "all sites" summary card with a watch list. The watch list (three plain-English concerns at the top of the grid) was the bit I said I was most pleased with. A few of you wrote back and said the same, with a follow-up ask: could it do more, and could you make it bigger?
So I did. The all-sites card is now full-width across the top of the dashboard, and it opens with a short paragraph describing the state of your sites, followed by up to three numbered things to look at today.
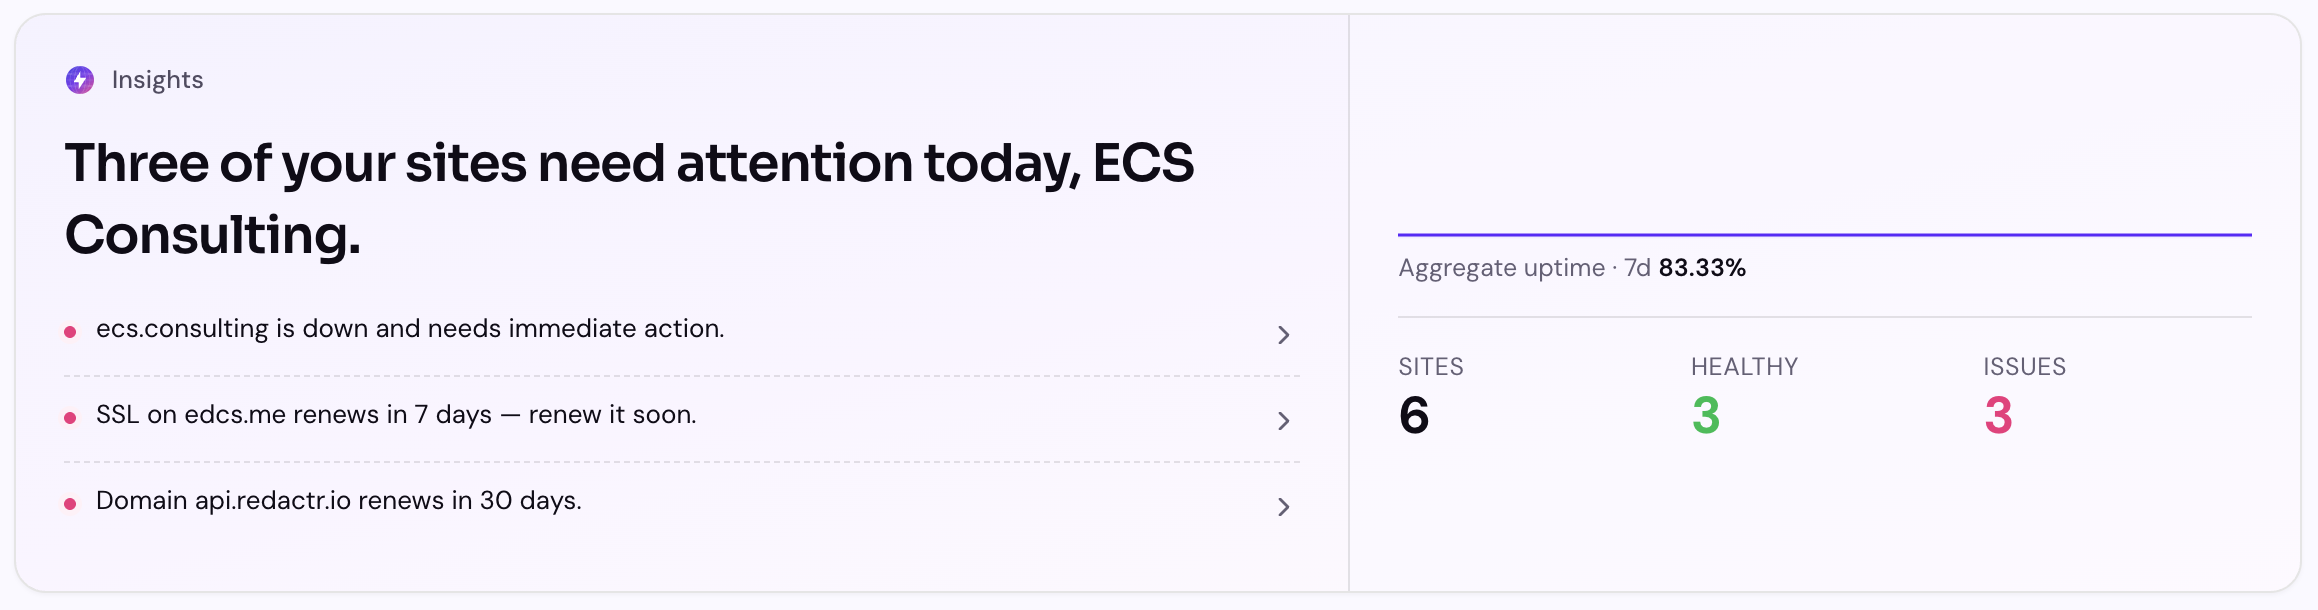
The paragraph is the room-temperature read. The bullets are the to-do list. Click any of them and you land on the affected site, scrolled to the bit that needs looking at.
When everything's calm, the card says so, and the bullets give way to a single "on the horizon" line. Usually the next renewal coming up. The card never sits there feeling empty.
How it picks what to surface
The same severity rules as the per-site cards, with a few extras:
- Open incidents lead, with how long they've been going and the most useful first thing to check.
- Slowness has to persist. A single blip doesn't make the list. It has to be slow against the site's own baseline for long enough to matter.
- SSL expiry is compared against when the cert was last issued. Let's Encrypt rotates every ~90 days, so a fresh cert with a month left is routine plumbing, not an emergency. The card stays quiet about it.
- Domain renewals are the same. A domain approaching the anniversary of its last renewal is a normal cycle, not a problem. It only surfaces if something looks abnormal.
The card is deliberately cautious. The cost of crying wolf is high — you stop reading the card.
The same idea, on the site page
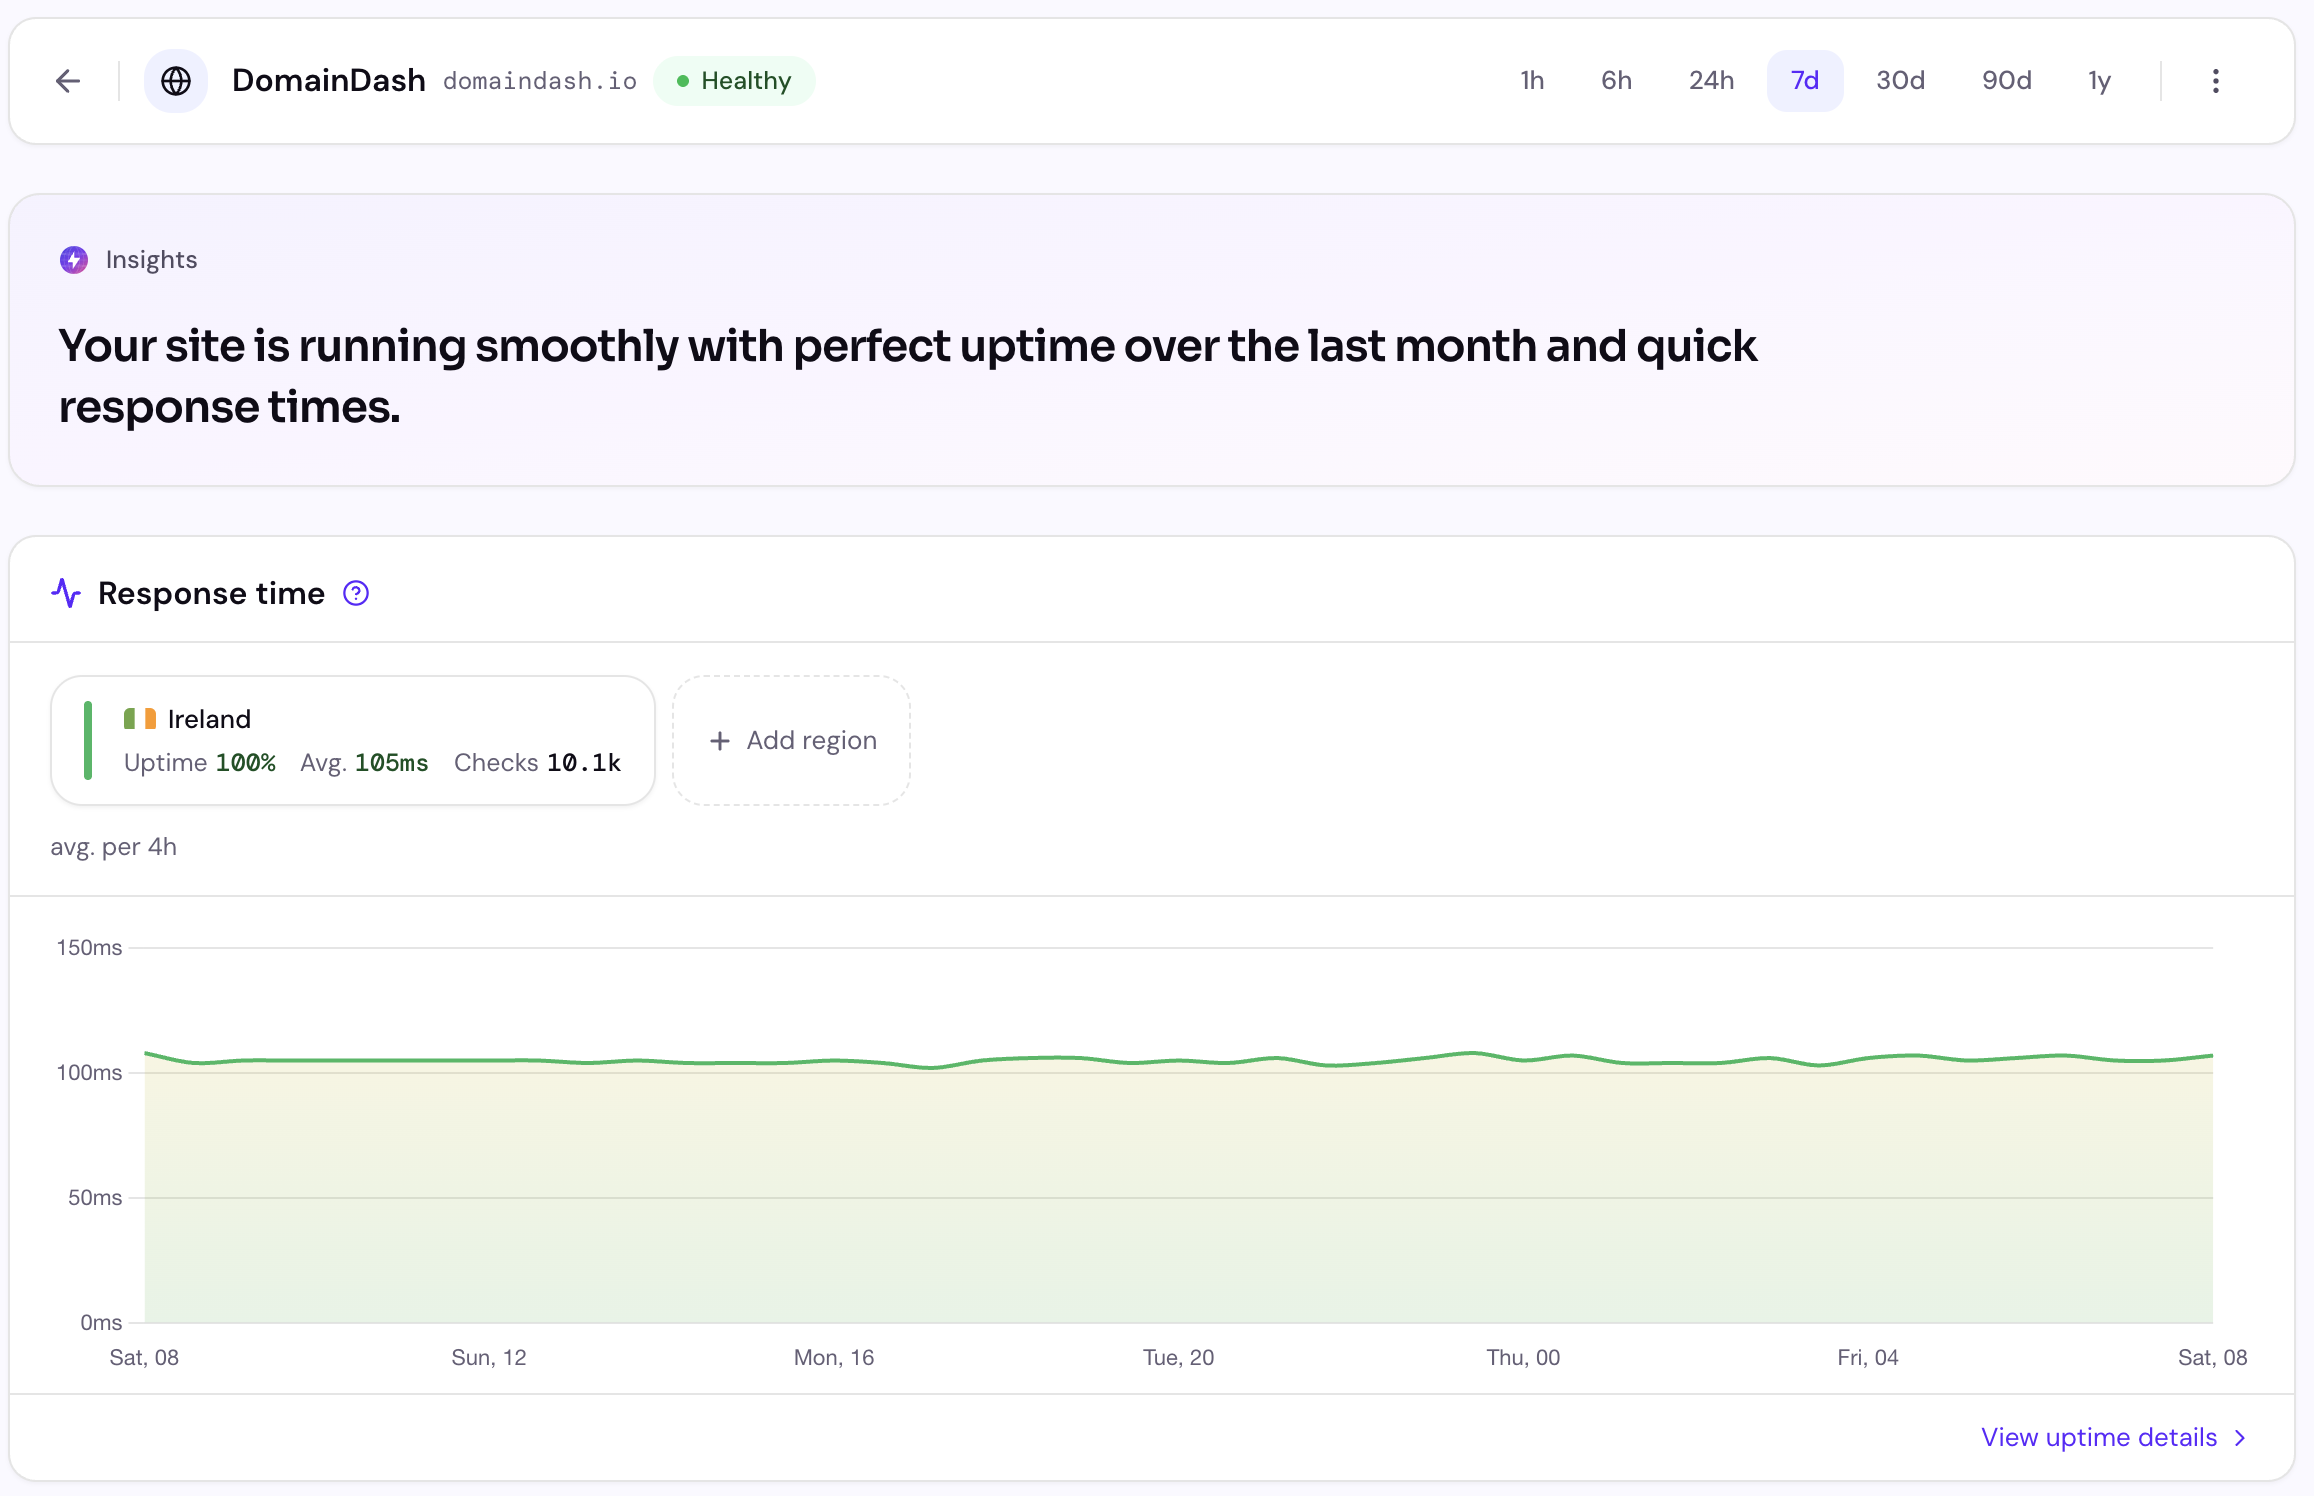
Open any individual site and the same kind of card now sits between the alert area and the response-time chart, but only for that site.
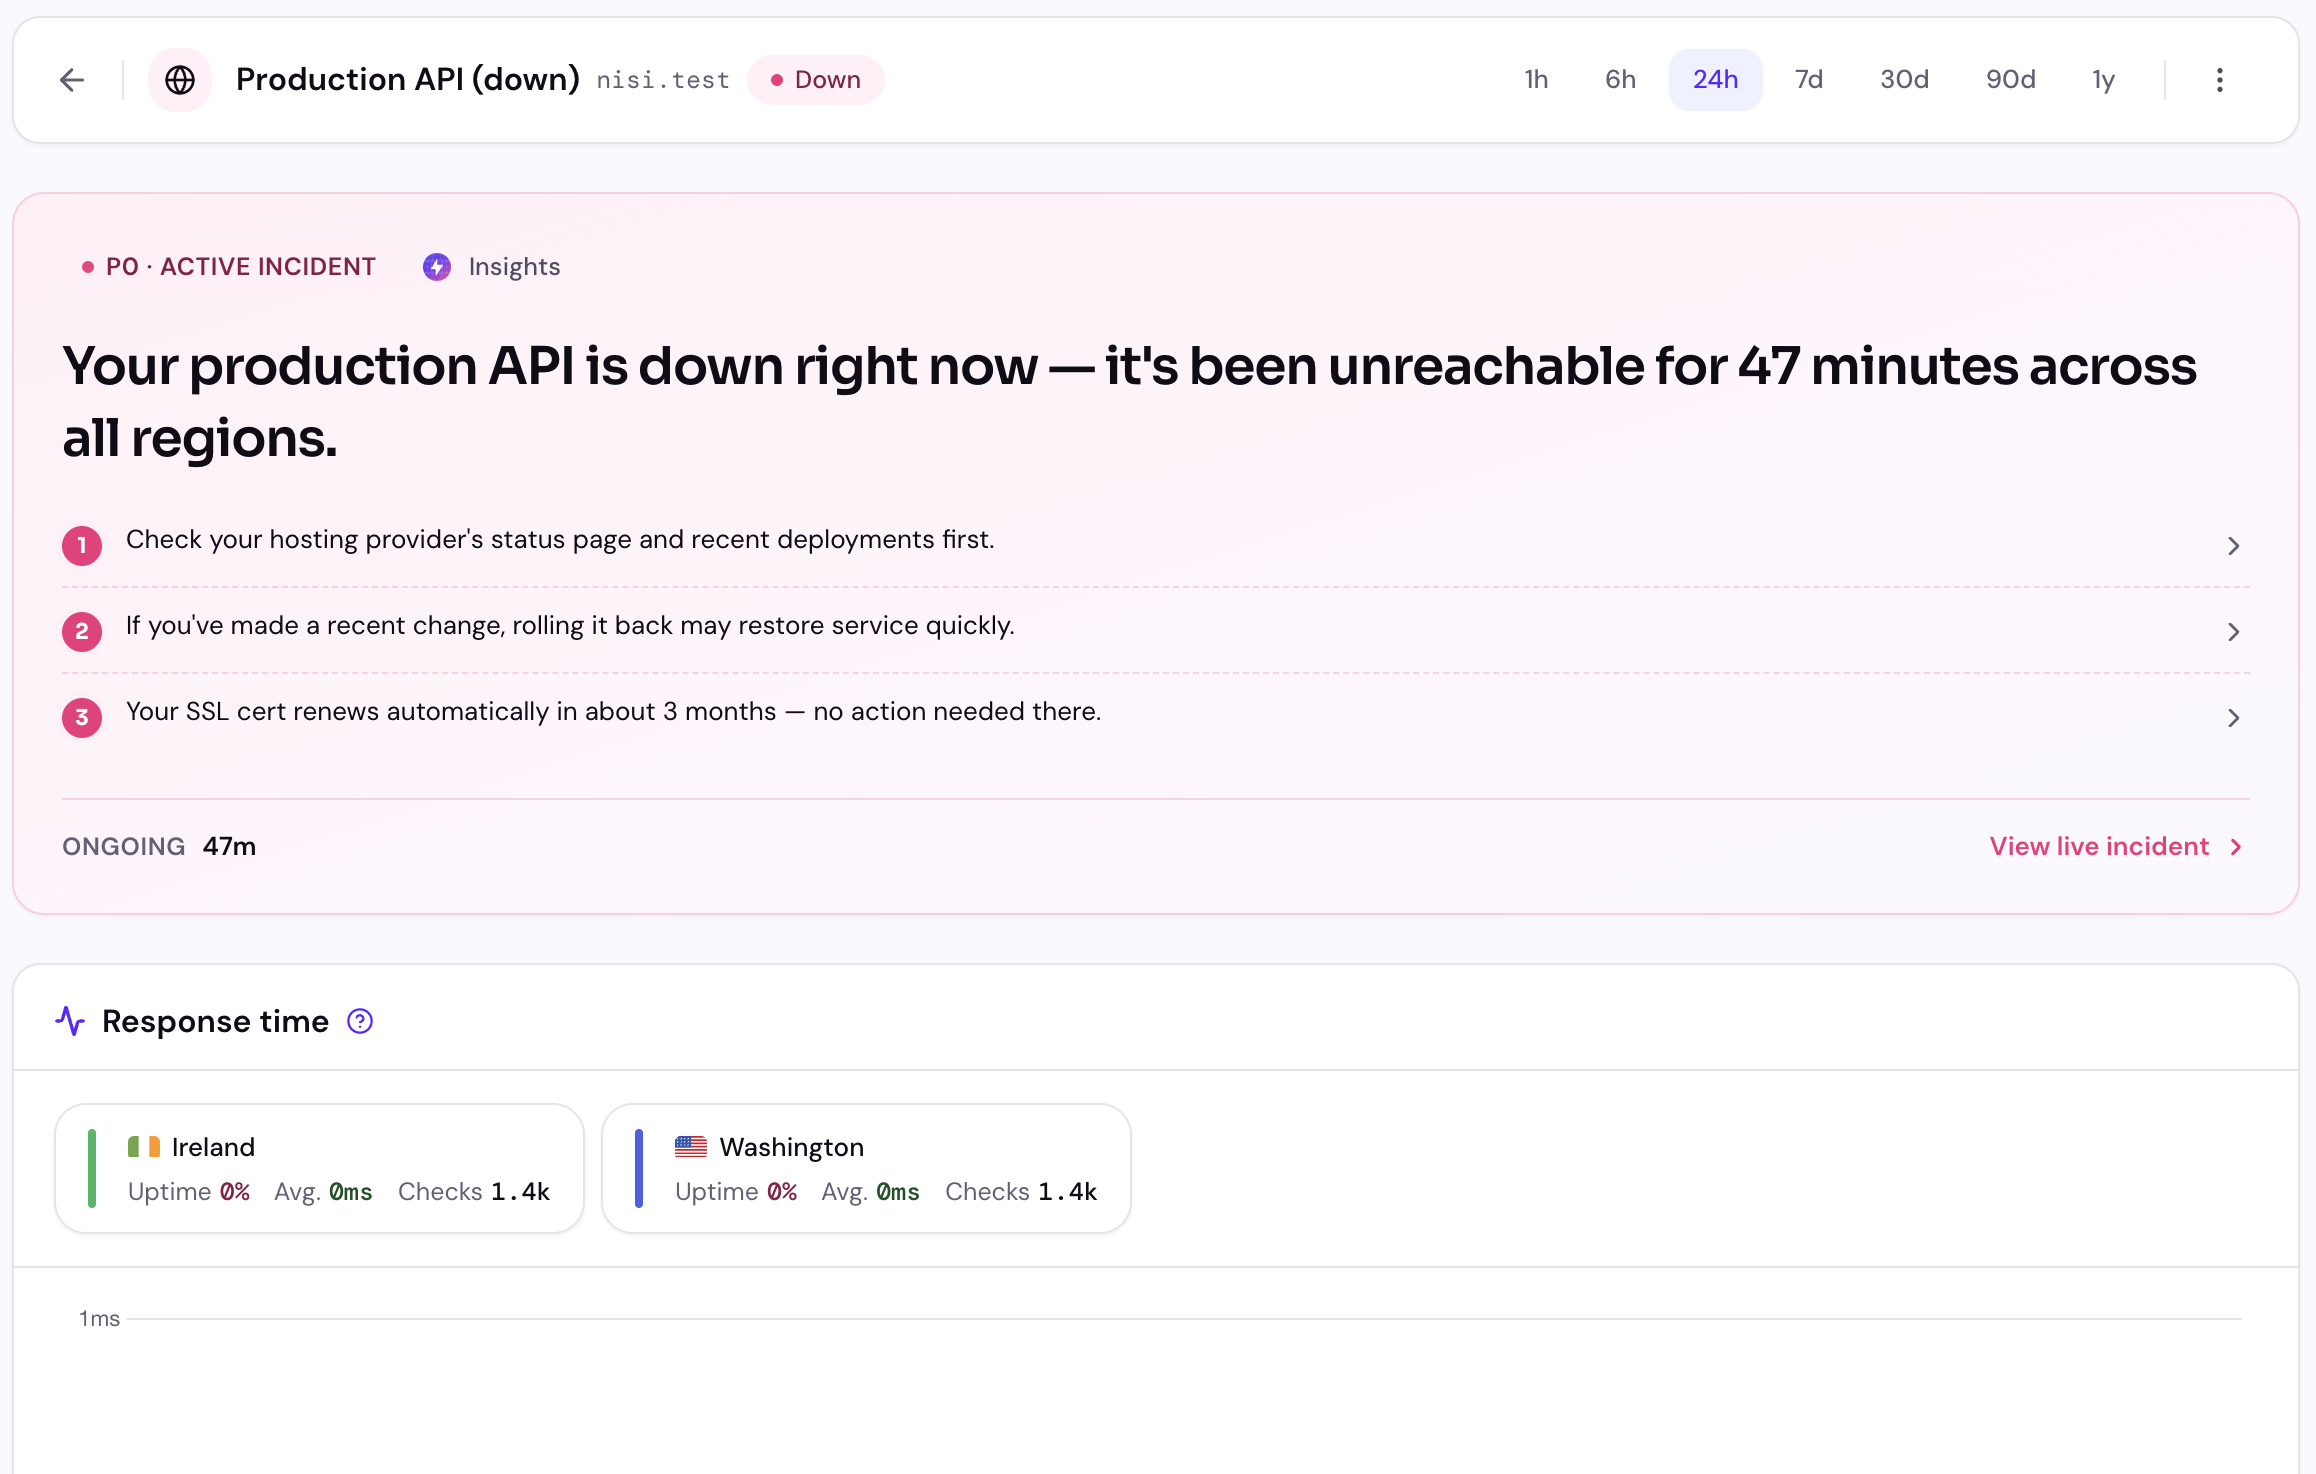
If there's an active incident, the card leads with it. It turns red, the bullets become numbered next steps, and the footer carries an "ongoing 17h 35m" timer plus a link straight to the live incident view.
If everything's calm, you get one reassuring sentence and maybe a renewal line. Same idea, smaller scope.
Who gets it
It's part of the Starter plan and up. If you're on Free, the dashboard still shows the watch list you've always had. The written paragraph and richer bullets are the bit that requires a paid plan.
If you've been kicking the tyres, the same ask as last time: tell me whether the paragraph picks the right things to surface for your sites. If it's noisy, or if it's leading with the wrong thing, that's the bug worth hearing about. ed@domaindash.io or via the in-app chat.